Your health.
Intelligently
connected.
Control 40 unifies your data, devices, and daily habits with advanced AI to help you prevent issues, optimize performance, and live healthier—every day.
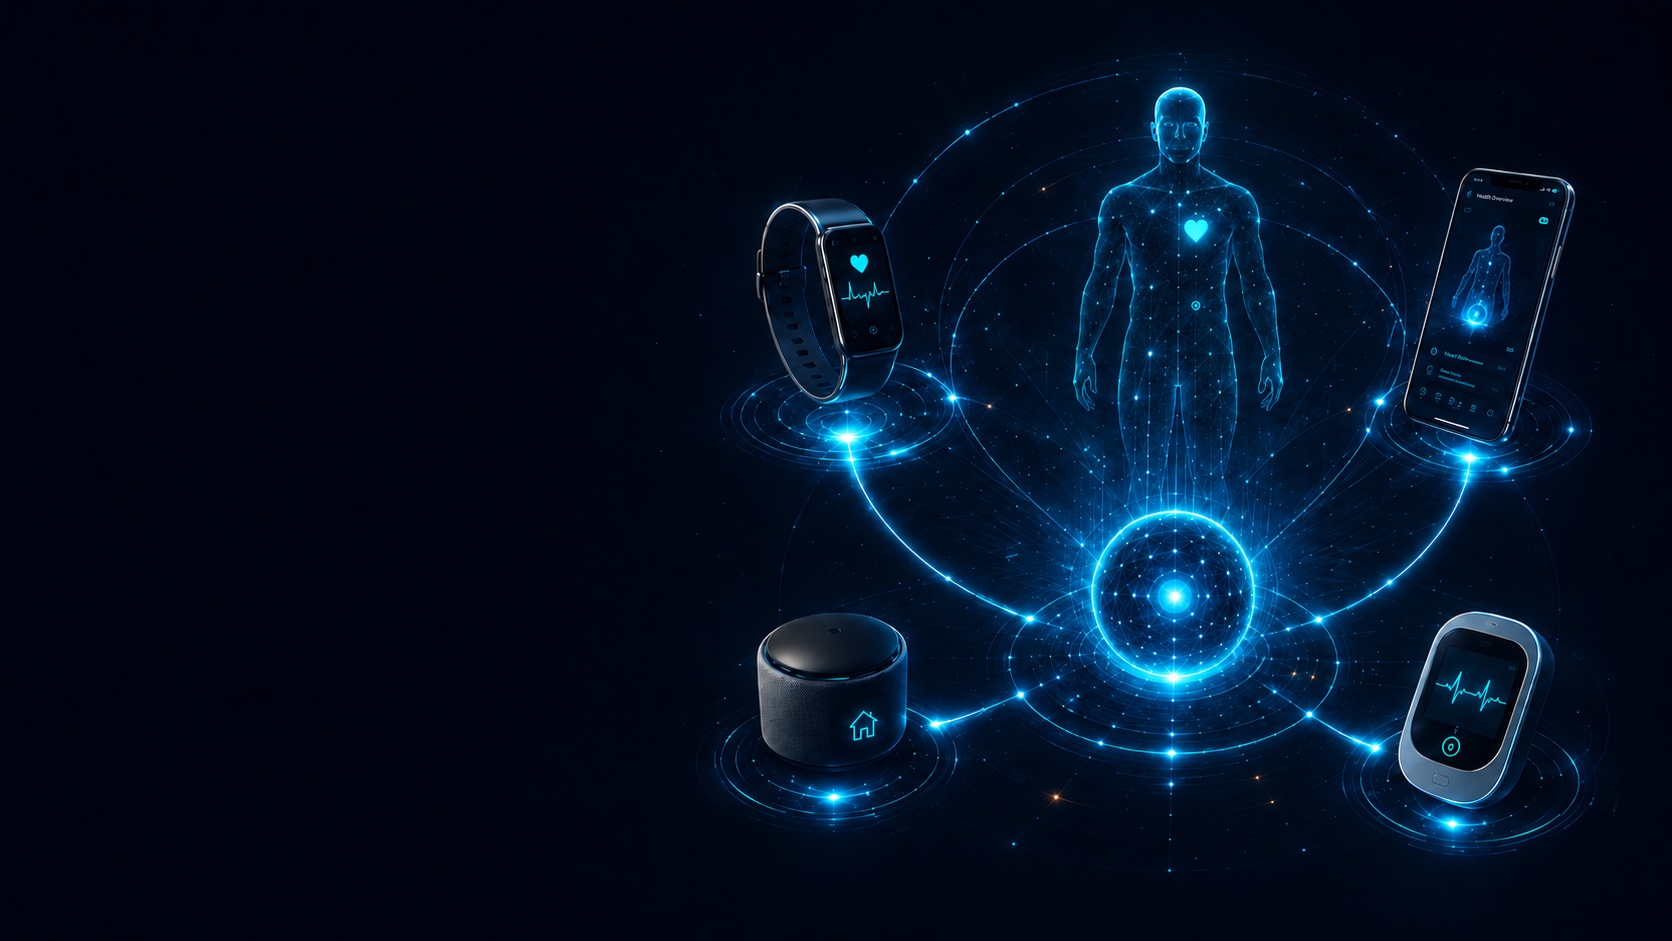
Healthcare has an observation problem.
Chronic disease is continuous. Healthcare is episodic. A condition can develop across months or years, while clinicians see only a handful of isolated moments.
Decisions are made on snapshots.
Lives are lived in between them.
We know more about people than ever — but rarely see the whole person.
Four bodies of information already exist. They are generated in different places, held by different systems, and almost never speak to each other.
Continuous, unread
- Wearables
- Sleep & recovery
- Activity
- Nutrition
Precise, occasional
- Blood panels
- Imaging
- Home measurement
- Biomarkers
Authoritative, siloed
- Clinical records
- Medication
- Encounters
- Referrals
Rarely fed back
- What changed
- What worked
- What did not
- What to learn
Control 40 closes the loop.
Seven steps, running continuously around one person. Select any step to see what it does.
The first forty days: understand me.
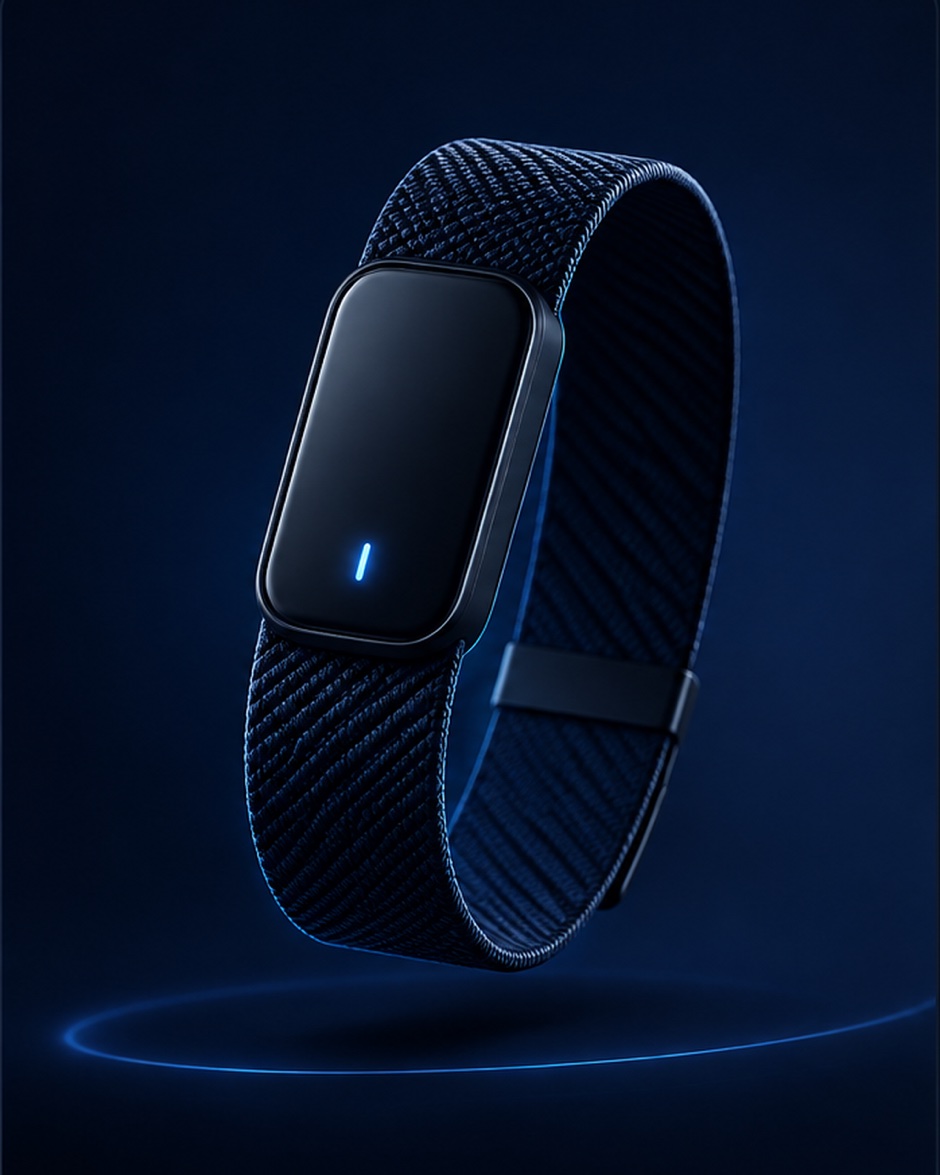
The wearable observes for forty days — your sleep, your rhythms, your responses, your variability — while Control 40 builds your baseline.
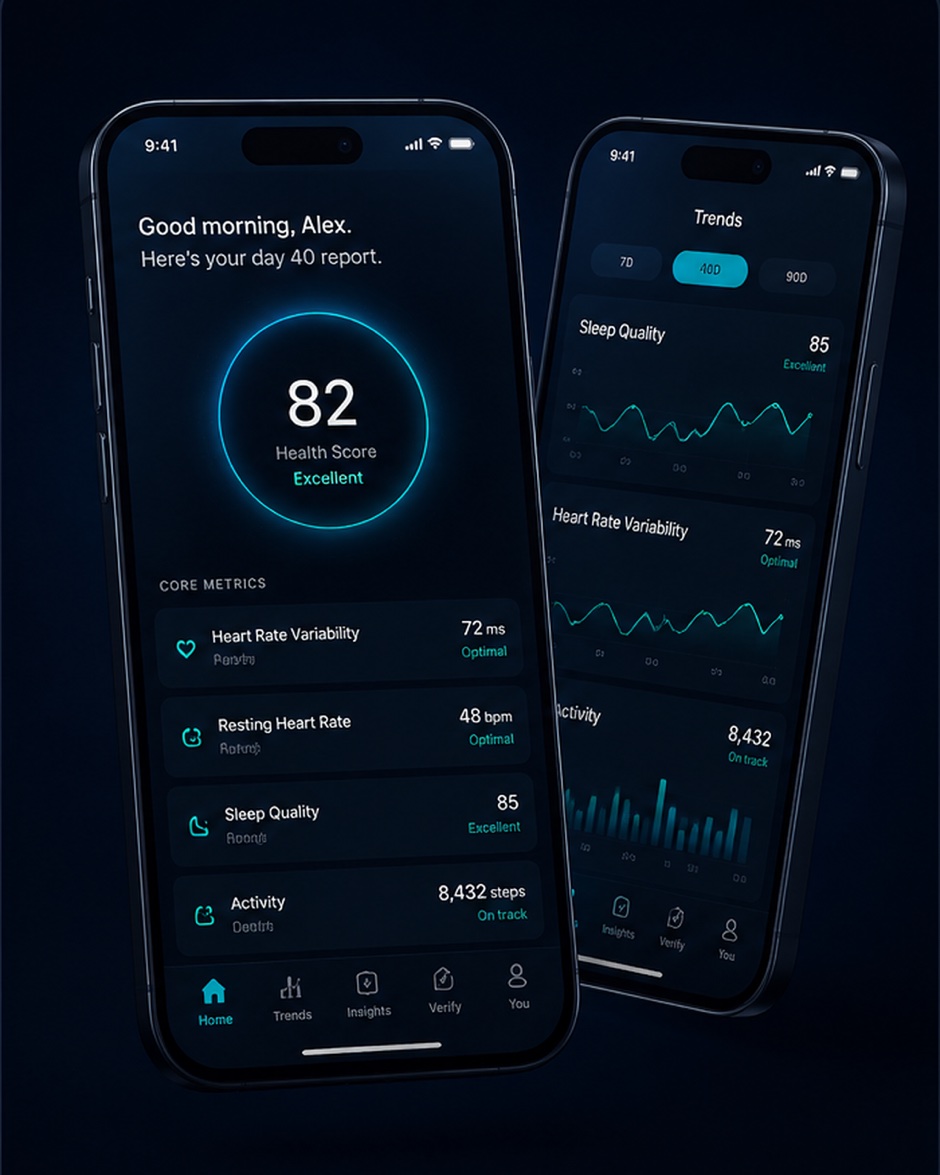
- Your baseline, established and explained
- The patterns found in your first forty days
- Verified measurements, with method and source
- Focus areas for the next ninety days
- A one-page, clinician-ready summary
From day 41, the AI already knows you. Every answer starts from your full picture — never from zero.
assets/wearable.jpg
assets/app.jpg
One AI. Your wrist, your home, your record.
The wearable, the home station and the app feed one intelligence that knows you. Pick an area — this is how it works, on screen.
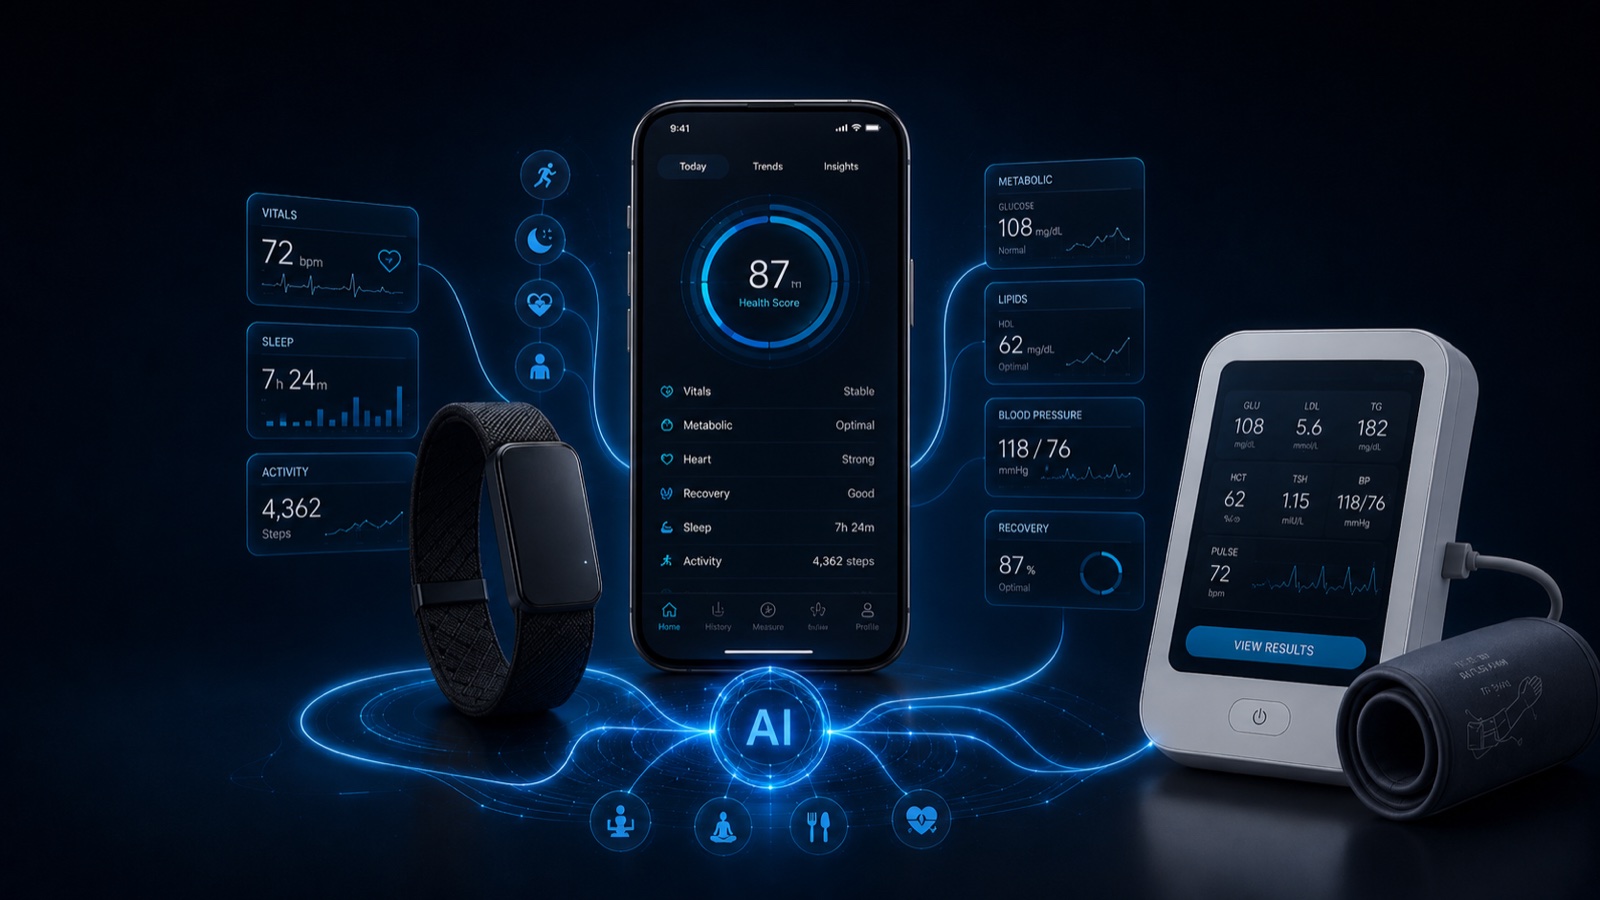
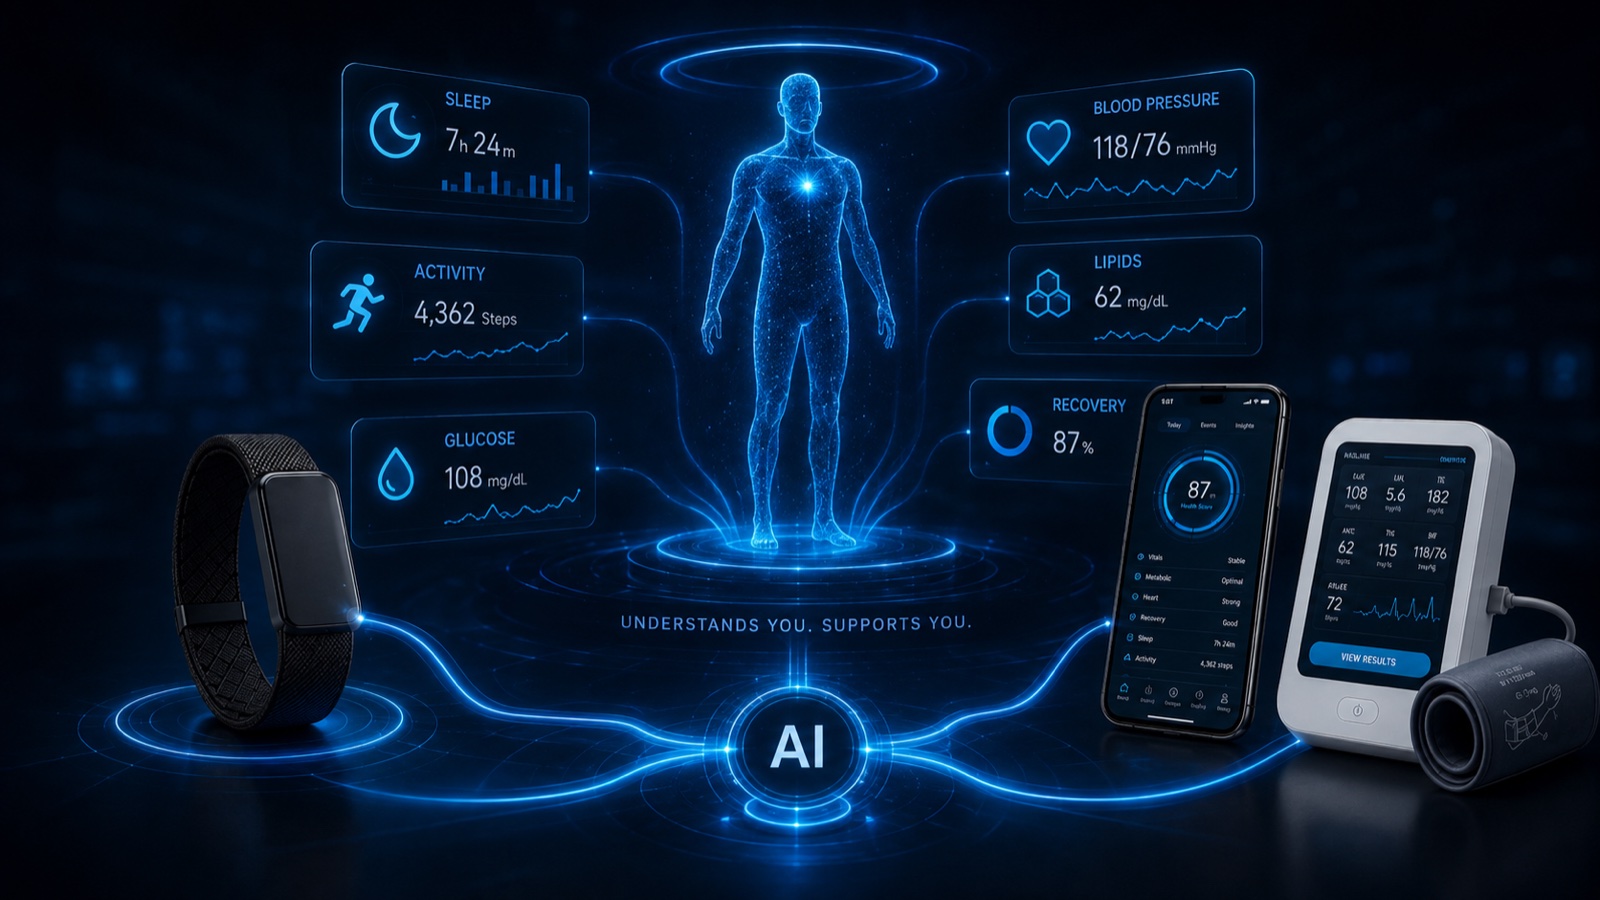
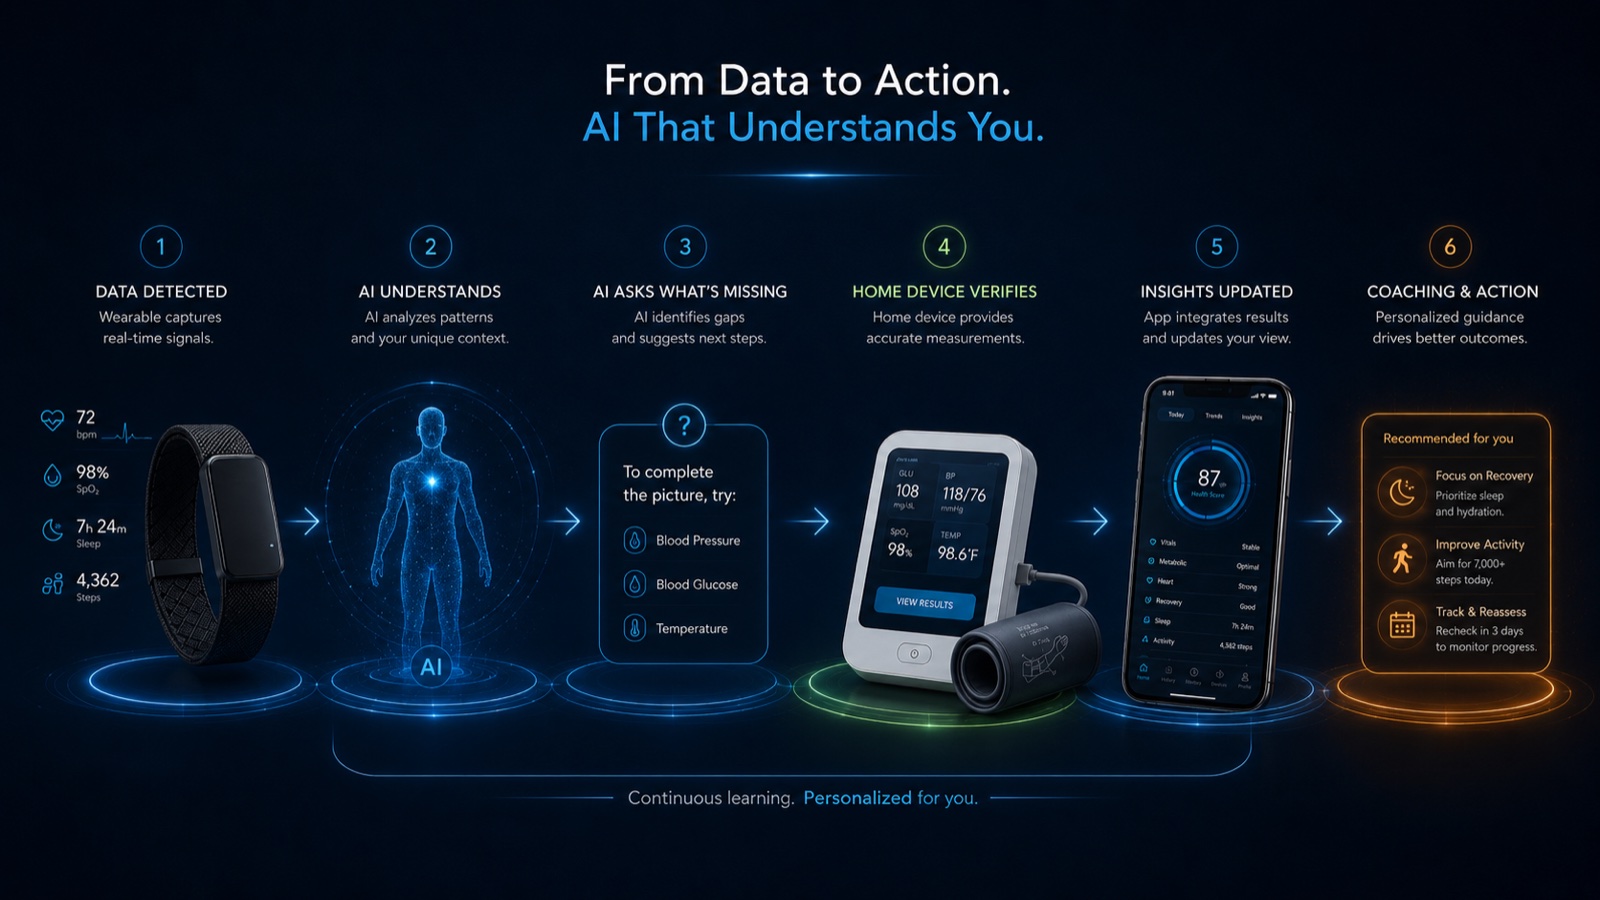
Design concepts. Control 40 is pre-MVP.
Interface shown is a design concept. Control 40 is pre-MVP.
How the AI elevates a signal into an answer.
Every reading enters raw and leaves understood. The same discipline is applied to every signal — a night of sleep, a glucose curve, a laboratory result. Here is one blood-pressure reading, climbing the ladder.
Raw signal
A number with no meaning on its own.
Context attached
Source, method, timing and conditions travel with the value — permanently.
Read against your baseline
Compared with you — not with a population average.
Pattern, not panic
One reading is noise. A shape over time is information.
Uncertainty checked
When the data is not enough, the system asks for what is missing. It never fills the gap with guesswork.
Explained in plain language
The answer comes first. Data used, source and confidence sit underneath it, one tap away.
The right next step
Coaching, education or clinician — routed by design, proportionate to what was found.
Same number. Seven levels of meaning. The Companion only ever speaks from the top of the ladder.
Every answer starts with the answer, in plain language — never a wall of charts.
Confidence is a visible number, and low confidence changes what happens next.
One proportionate next step — and a clinician brought in when it matters.
Illustrative sequence. Control 40 is pre-MVP; thresholds and protocols will be defined with clinical partners.
A companion, not just a dashboard.
Every answer carries its own evidence: what was used, where it came from, how confident the system is, and why it is saying this now.
01 It answers in one line
The response comes first. The reasoning is available underneath, not stacked in front of it.
02 It shows the data it used
Every claim is traceable to the specific signals behind it — not to a general model impression.
03 It labels where data came from
Wearable, home device, laboratory, clinical record. Source and permission travel with the data point.
04 It states its confidence
Confidence is a visible number, and low confidence changes what the system does next.
05 It knows your history
Context builds over months. The Companion compares you to your own baseline, not to a population average.
06 It knows when to hand over
The right insight reaches the right person — escalation is designed in, not improvised:
Interface shown is a design concept. Control 40 is pre-MVP.
What it measures — and what it does not pretend to.
Three tiers of signal carry three levels of certainty. Control 40 keeps them honestly separated, and usefully connected.
On the wrist
- Heart rate & resting HR
- Heart-rate variability
- Sleep & recovery
- Activity
- SpO₂ & temperature trends
- Stress indicators
Connected health
- Validated blood-pressure cuff
- Smart scale
- Glucometer / CGM
- Home measurement protocols
- Medication adherence
Clinical truth
- HbA1c & lipids
- Kidney & liver markers
- Laboratory panels
- Medical history
- Clinician review
A wearable never diagnoses. A laboratory never watches daily life. Control 40 is the layer that lets each do its job — and connects all three.
assets/testing-station.jpg
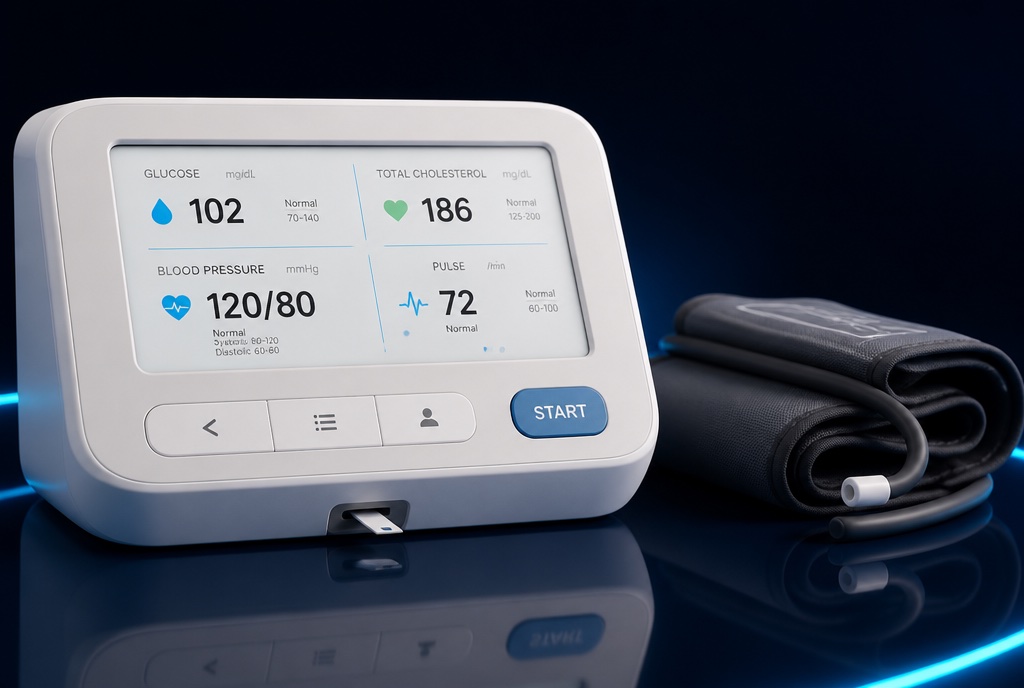
A home testing station, not just a wristband.
Wearables observe. This station measures — a deeper biological picture from home, in seconds, saved automatically into your record.
- Results in seconds — glucose in about five
- Longitudinal home testing between appointments
- Feeds the Verify step with validated readings
From lifestyle tracking to a broader biological picture.
Reference hardware in evaluation for the first cohort.
Better AI requires better information.
Most systems produce an answer from whatever data happens to be available. Control 40 is designed to notice when that data is not enough — and to go and get what is missing.
Reading above baseline
Home cuff, evening. Seven-day average has drifted upward.
Context is not enough
Single evening reading, taken after activity, unconfirmed device position.
A validated repeat measurement
Morning, seated, five minutes rest, two readings one minute apart.
New information added
Protocol confirmed. The record now carries method, timing and conditions.
Next action adjusted
Fourteen-day structured monitoring, with a clinician summary if the trend holds.
When the available data is insufficient, Control 40 is designed to recognise uncertainty rather than manufacture certainty.
One longitudinal picture of you.
Signals from different sources, carrying their own origin, permission and context, resolved into a single continuous record with a baseline, a trend and an outcome.
The device is a sensor, not the record. Replacing it should not restart your history.
The story travels with you, with permission, in a form a clinician can read in under a minute.
Care moves. Continuity should move with it, across borders and health systems.
The value is not in any single device. It is the longitudinal record, the clinician workflow and the behaviour loop that runs between them.
Integrations are part of the planned architecture. Availability will depend on partners, approvals and market.
One record, felt everywhere.
The same continuous understanding shows up wherever life happens — in movement, in sleep, in recovery and in the long run.
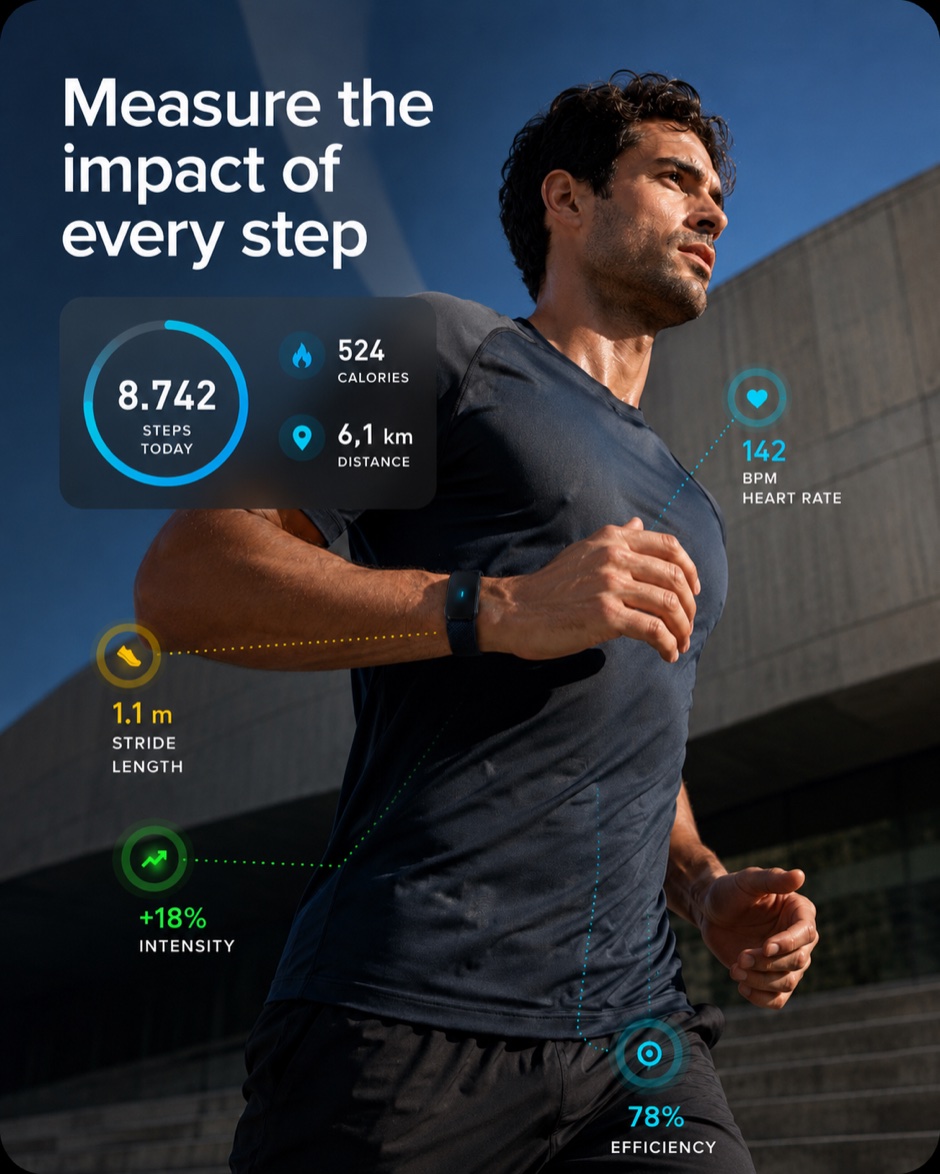
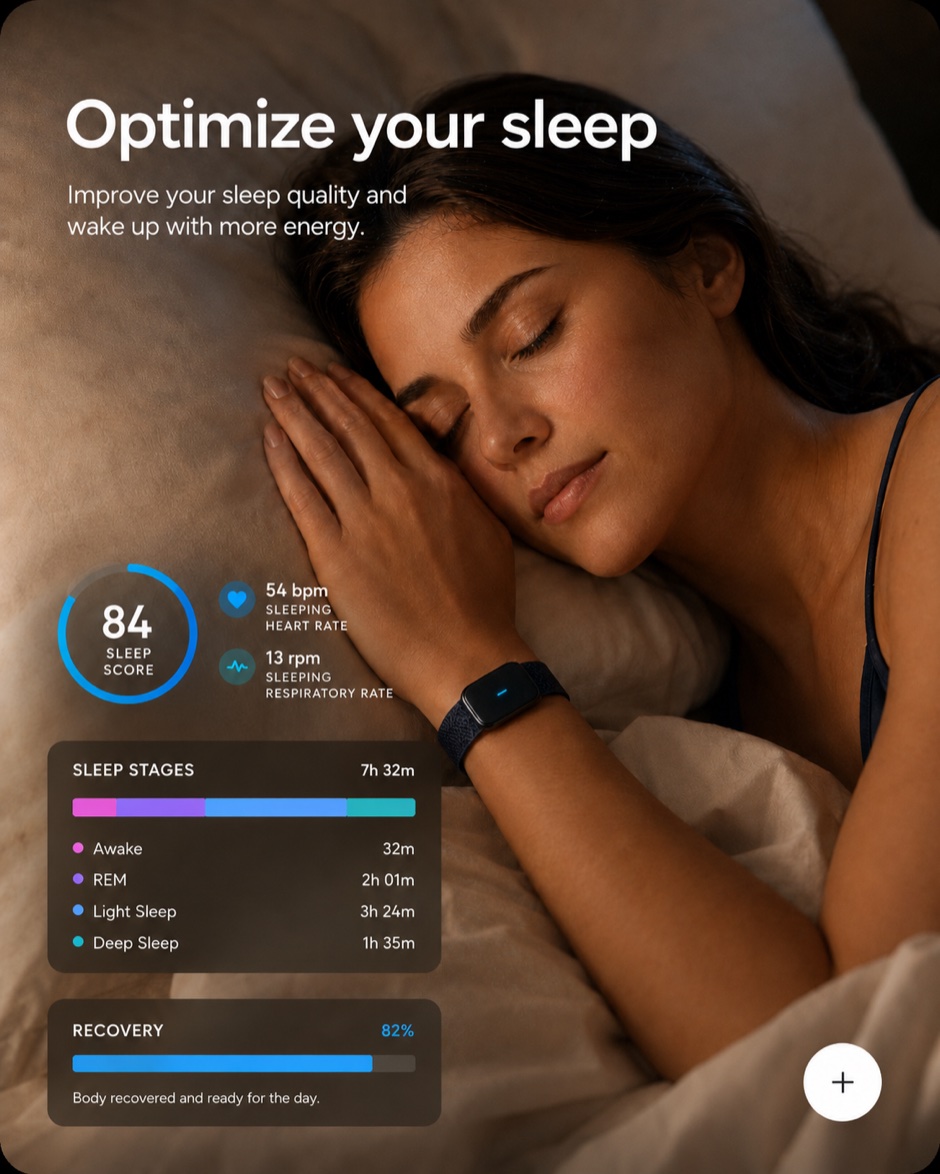
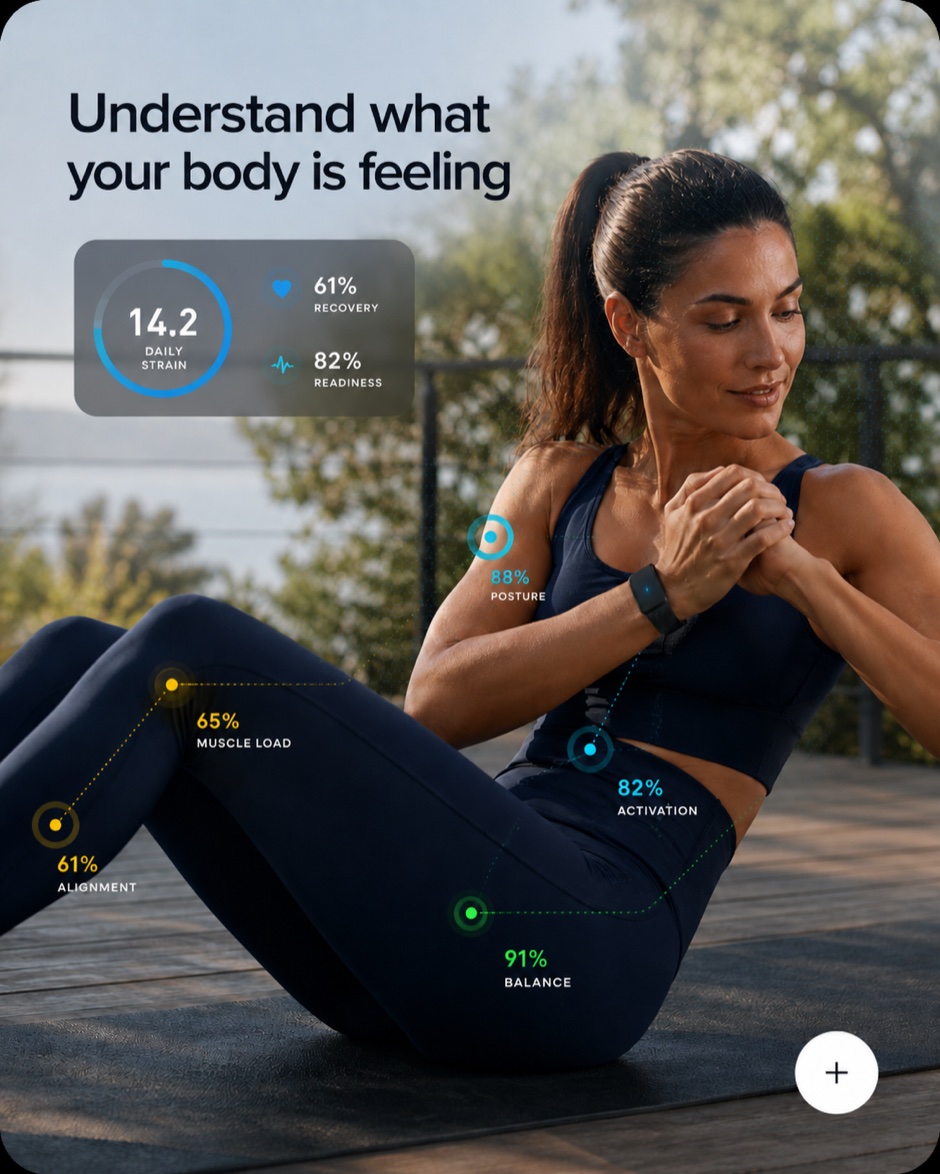
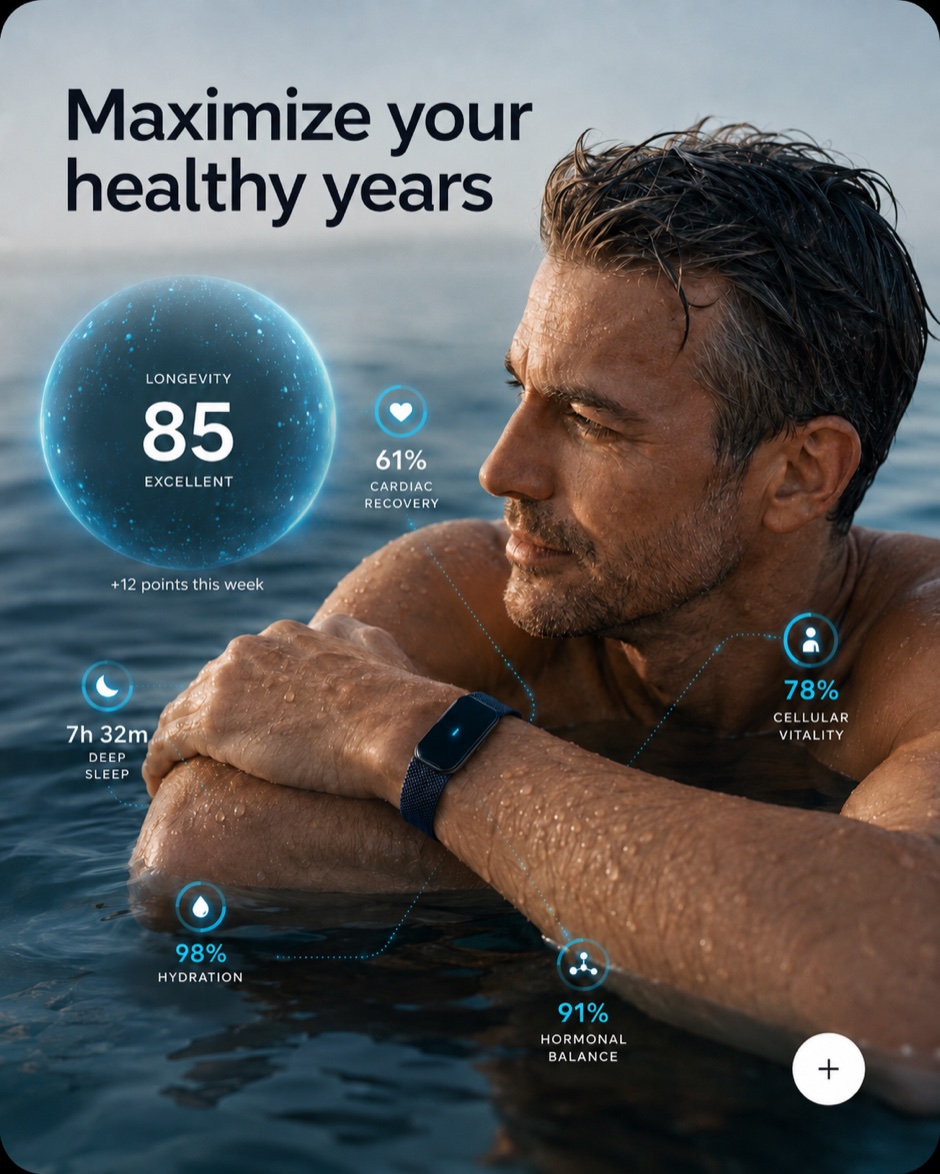
Concept imagery. Interfaces and metrics shown are illustrative — Control 40 is pre-MVP.
The same continuous record, read six different ways.
Health data becomes more valuable when it becomes evidence.
A signal on its own is worth little. A signal linked to a verified change, an intervention and a measured outcome is worth a great deal — to the person, and to medicine.
Not data for sale.
Participation is explicit, scoped and revocable. Commercial value is created through governed evidence programmes with named partners — never through the indiscriminate sale of personal health data.
A global problem, measured in hundreds of millions.
The observation gap is not a niche. It is the default condition of chronic care, everywhere.
The need is global. The observation gap is universal. The infrastructure to close it does not exist yet.
Source: IDF Diabetes Atlas, 11th edition (2025) — 2024 estimates.
Long-term potential, not a forecast.
One case study makes the scale concrete: Pakistan, where 34.5M adults live with diabetes. Exploring the potential value of the Control 40 programme across different penetration levels.
Rs59,900 (≈$215) per cohort entry
≈ Rs2,066,550,000
≈ Rs20,695,500,000
≈ Rs103,297,500,000
≈ Rs206,595,000,000
Market-sensitivity scenarios, not operating forecasts — for strategic discussion only. Actual results depend on execution, adoption and market dynamics.
Built for global health. Launching UAE-first.
Abu Dhabi brings clinical density, national health infrastructure, an AI mandate and a realistic path to validation — the right conditions to prove a system like this before scaling it.
United Arab Emirates
Abu Dhabi as the clinical, AI, research and validation base. First partnerships, first cohort, first evidence.
GCC
Regional expansion on proven architecture, with metabolic and preventive health as the leading programmes.
UK & Europe
Entry into mature regulatory markets, with portability and permissioned records designed in from the start.
Global by design
One system, multiple jurisdictions. Data residency, consent and governance are structural, not retrofitted.
Early, deliberate, and clear about what exists.
Control 40 is pre-seed and pre-MVP. The architecture, the product direction and the governance principles are defined. We would rather show that honestly than dress it up.
Haroon
Leading the definition of the Control 40 architecture, product direction and institutional strategy, and building the founding team in Abu Dhabi.
- Clinical lead
- AI / ML engineering
- Health data architecture
- Product design
- Research partnerships
- Regulatory & governance
- Architecture & AI-governance principles defined
- Founding roles opening in Abu Dhabi
- First clinical and partner conversations
- MVP with a first cohort in the UAE
- Validated measurement protocols with partners
- Clinician one-page summaries, piloted
- Governed research & evidence programmes
- GCC, then UK & Europe
- Portability across devices, doctors and borders
Control 40 does not diagnose, treat or replace medical care. The platform is designed to support individuals and clinicians with better organised, better verified information.
Health should not begin when something goes wrong.
We are looking for clinical, research, diagnostic and institutional partners to build and validate the first version of Control 40 in the UAE.